Auswertung von Dump-Files

Hm, das müßte aber exakt der gleiche Code sein wie bei der Erzeugung der .exe - gleicher Compiler und Compiler-/Linkeroptionen ebenfalls. Aber selbst dann fürchte ich das es wahrscheinlich nicht funktioniert.
Du fürchtest richtig: das Executable bekommt bei der Erzeugung eine neue GUID zugewiesen, welche im Executable und in der PDB-Datei hinterlegt wird. Die GUID wechselt bei jedem Build. Selbst bei absolut identischer Buildumgebung kann man eine PDB also nicht bitgenau reproduzieren. Passen GUID von Executable (die im Debug Dump hinterlegt ist) und PDB nicht zusammen, weigern sich WinDbg & co. die Symbole zu laden. Darum sollte man für jedes ausgelieferte Build die PDBs sorgfältig aufbewahren.

Grüße
Matthias
 
Moin,

ja, ok - dann komme ich wohl mit dem vorhandenen Dump nicht weiter .... :-(
Da ich jetzt vor den Feiertagen auch nichts mehr im Livesystem ändern soll, ist das ganze bis zum neuen Jahr erstmal auf Eis gelegt!

Danke Euch für die Ausführungen - dann werde ich mich erstmal in den nächsten Tagen mal mit den Links weiter da reinfuchsen!

Gruß und frohe Weihnachten
Klaus
 
Guten morgen,

ich muss mich doch noch mal zu diesem Thema melden ...

Ich mittlerweile die Anwendung laufen lassen und mir dazu die konkrete pdb-Datei gesichert
Als Symbolfile-Path habe ich neben "SRV*C:\Ablage\DebuggingTools\symbols*http://msdl.microsoft.com/download/symbols" auch den Pfad, in dem die pdb-Datei liegt eingeben.

Leider ändern sich die Ausgaben von WinDbg nicht wirklich, da imme rnoch von nicht gefundenen Symbolen die Rede ist ...
C++:
Microsoft (R) Windows Debugger Version 6.10.0003.233 X86
Copyright (c) Microsoft Corporation. All rights reserved.


Loading Dump File [C:\!!_ANALYSE\GSWorkerServer.exe.exp.dmp]
User Mini Dump File: Only registers, stack and portions of memory are available

Symbol search path is: SRV*C:\Ablage\DebuggingTools\symbols*http://msdl.microsoft.com/download/symbols
Executable search path is: 
Windows XP Version 2600 (Service Pack 3) MP (2 procs) Free x86 compatible
Product: WinNt, suite: SingleUserTS
Machine Name:
Debug session time: Fri Jan 10 20:25:22.000 2014 (GMT+1)
System Uptime: not available
Process Uptime: 0 days 11:03:54.000
................................................................
........
This dump file has an exception of interest stored in it.
The stored exception information can be accessed via .ecxr.
(12ec.4ec): Access violation - code c0000005 (first/second chance not available)
eax=01f00000 ebx=0020e030 ecx=00000007 edx=7c91e514 esi=0020e008 edi=0020e060
eip=7c91e514 esp=022794c4 ebp=022794d4 iopl=0         nv up ei pl zr na pe nc
cs=001b  ss=0023  ds=0023  es=0023  fs=003b  gs=0000             efl=00000246
ntdll!KiFastSystemCallRet:
7c91e514 c3              ret
0:009> !analyze -v
*******************************************************************************
*                                                                             *
*                        Exception Analysis                                   *
*                                                                             *
*******************************************************************************

*************************************************************************
***                                                                   ***
***                                                                   ***
***    Your debugger is not using the correct symbols                 ***
***                                                                   ***
***    In order for this command to work properly, your symbol path   ***
***    must point to .pdb files that have full type information.      ***
***                                                                   ***
***    Certain .pdb files (such as the public OS symbols) do not      ***
***    contain the required information.  Contact the group that      ***
***    provided you with these symbols if you need this command to    ***
***    work.                                                          ***
***                                                                   ***
***    Type referenced: kernel32!pNlsUserInfo                         ***
***                                                                   ***
*************************************************************************
*************************************************************************
***                                                                   ***
***                                                                   ***
***    Your debugger is not using the correct symbols                 ***
***                                                                   ***
***    In order for this command to work properly, your symbol path   ***
***    must point to .pdb files that have full type information.      ***
***                                                                   ***
***    Certain .pdb files (such as the public OS symbols) do not      ***
***    contain the required information.  Contact the group that      ***
***    provided you with these symbols if you need this command to    ***
***    work.                                                          ***
***                                                                   ***
***    Type referenced: kernel32!pNlsUserInfo                         ***
***                                                                   ***
*************************************************************************

FAULTING_IP: 
GSWorkerServer+ab915
004ab915 ****              ****?

EXCEPTION_RECORD:  ffffffff -- (.exr 0xffffffffffffffff)
ExceptionAddress: 004ab915 (GSWorkerServer+0x000ab915)
   ExceptionCode: c0000005 (Access violation)
  ExceptionFlags: 00000000
NumberParameters: 2
   Parameter[0]: 00000000
   Parameter[1]: fffffff9
Attempt to read from address fffffff9

PROCESS_NAME:  GSWorkerServer.exe

ERROR_CODE: (NTSTATUS) 0xc0000005 - Die Anweisung in "0x%08lx" verweist auf Speicher in "0x%08lx". Der Vorgang  "%s" konnte nicht auf dem Speicher durchgef hrt werden.

EXCEPTION_CODE: (NTSTATUS) 0xc0000005 - Die Anweisung in "0x%08lx" verweist auf Speicher in "0x%08lx". Der Vorgang  "%s" konnte nicht auf dem Speicher durchgef hrt werden.

EXCEPTION_PARAMETER1:  00000000

EXCEPTION_PARAMETER2:  fffffff9

READ_ADDRESS:  fffffff9 

FOLLOWUP_IP: 
GSWorkerServer+ab915
004ab915 ****              ****?

FAULTING_THREAD:  000004ec

DEFAULT_BUCKET_ID:  STATUS_ACCESS_VIOLATION

PRIMARY_PROBLEM_CLASS:  STATUS_ACCESS_VIOLATION

BUGCHECK_STR:  APPLICATION_FAULT_STATUS_ACCESS_VIOLATION

IP_ON_HEAP:  fdb3f7b2

FRAME_ONE_INVALID: 1

LAST_CONTROL_TRANSFER:  from fdb3f7b2 to 004ab915

STACK_TEXT:  
WARNING: Stack unwind information not available. Following frames may be wrong.
0227a8cc fdb3f7b2 0227baf0 cccccccc cccccccc GSWorkerServer+0xab915
0227b24c 004a7824 0227b768 0014d437 00000000 0xfdb3f7b2
0227bafc 00464a54 0014d437 00000000 00202020 GSWorkerServer+0xa7824
0227c02c 00456671 00000005 00000056 00000009 GSWorkerServer+0x64a54
02285bfc 004480c8 022c2e58 00000046 00000000 GSWorkerServer+0x56671
022fff70 006c097d 02115e00 fdbbba56 7c9265d0 GSWorkerServer+0x480c8
022fffa8 006c0a07 00000018 022fffec 7c80b729 GSWorkerServer+0x2c097d
022fffb4 7c80b729 02140368 7c9265d0 00000018 GSWorkerServer+0x2c0a07
022fffec 00000000 006c09a3 02140368 00000000 kernel32!BaseThreadStart+0x37


STACK_COMMAND:  ~9s; .ecxr ; kb

SYMBOL_STACK_INDEX:  0

SYMBOL_NAME:  GSWorkerServer+ab915

FOLLOWUP_NAME:  MachineOwner

MODULE_NAME: GSWorkerServer

IMAGE_NAME:  GSWorkerServer.exe

DEBUG_FLR_IMAGE_TIMESTAMP:  52cfaa8a

FAILURE_BUCKET_ID:  STATUS_ACCESS_VIOLATION_c0000005_GSWorkerServer.exe!Unknown

BUCKET_ID:  APPLICATION_FAULT_STATUS_ACCESS_VIOLATION_GSWorkerServer+ab915

Followup: MachineOwner
---------

Irgendwas scheine ich also noch falsch zu machen ... nur k. A. was :-(

Wäre für weitere Infos sehr dankbar :)
tschüss
Klaus
 
Zuletzt bearbeitet von einem Moderator:
Als Symbolfile-Path habe ich neben "SRV*C:\Ablage\DebuggingTools\symbols*http://msdl.microsoft.com/download/symbols" auch den Pfad, in dem die pdb-Datei liegt eingeben.
Wie hast du das genau bewerkstelligt? Kommando .sympath, Kommandozeilenoption -y, oder ganz anders? Ich frage nach, weil in der Ausgabe von WinDbg nur der Microsoft-Symbolserver auftaucht.

Grüße
Matthias
 
Moin Matthias,

nein, ganz anders :)

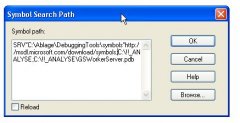
Ich habe "windbg.exe" im Windows Explorer aufgerufen (ist übrigens V6.10.0003.233 X86) und dann dort unter "File/Symbol Search Path" beides eingetragen! Zudem hatte ich noch den "File/Source File Path" gesetzt ...

Die dump-Datei und die PDB's lagen dabei im gleichen lokalen Verzeichnis

Scheint aber beides nicht wirklich geholfen zu haben, da die Sysmbole ja wohl immer noch nicht aufgelöst werden können. Kenne mich nun leider mit dem WinDBG auch nur sehr bedingt aus und die Seiten, die man via Google findet, sind auch nicht sonmderlich hilfreich! Werde aber nochmal nach den beiden von genannten Optionen suchen ...

Gruß
Klaus

EDIT-1: ScrShot beigefügt

EDIT-2:
Scheinbar werden die Modul-spezifischen Symbole nicht geladen .....

0:009> lml

start end module name
00400000 0081f000 GSWorkerServer T (no symbols)
11400000 11431000 W3NSL22E C (export symbols) W3NSL22E.DLL
597d0000 59825000 netapi32 (pdb symbols) C:\Ablage\DebuggingTools\symbols\netapi32.pdb\49D4D68E25CA4118A09AA9A66E7390E32\netapi32.pdb
59dd0000 59e71000 dbghelp (pdb symbols) C:\Ablage\DebuggingTools\symbols\dbghelp.pdb\7FA1C63A9BF54470BCA31E35A94F49971\dbghelp.pdb
66250000 66256000 nwsrvloc (export symbols) nwsrvloc.dll
774b0000 775ed000 ole32 (pdb symbols) C:\Ablage\DebuggingTools\symbols\ole32.pdb\ED517599D2C14CF19200861833059C142\ole32.pdb
7c800000 7c908000 kernel32 (pdb symbols) C:\Ablage\DebuggingTools\symbols\kernel32.pdb\072FF0EB54D24DFAAE9D13885486EE092\kernel32.pdb
7c910000 7c9c9000 ntdll (pdb symbols) C:\Ablage\DebuggingTools\symbols\ntdll.pdb\6992F4DAF4B144068D78669D6CB5D2072\ntdll.pdb
7e360000 7e3f1000 user32 (pdb symbols) C:\Ablage\DebuggingTools\symbols\user32.pdb\D18A41B74E7F458CAAAC1847E2D8BF022\user32.pdb
 

Anhänge

  • ScrShot.jpg
    ScrShot.jpg
    18,5 KB · Aufrufe: 11
Zuletzt bearbeitet:
Hi.

Du darfst nicht direkt die pdb in den Symbolpfad eintragen. Da sollten nur Verzeichnisse eingetragen werden.

Normalerweise packe ich die .exe, .pdb und .dmp Datei in das gleiche Verzeichnis, dann findet WinDbg das auch alles.
 
Moin,

ja, habe ich auch gemerkt und inzwischen entfernt !

Ok, meine EXE habe ich in dem Pfad nicht liegen. Reicht dafür nicht der Pfadeintrag in "Source File Path" ****

Gruß
Klaus
 
Zurück