son gohan
Erfahrenes Mitglied
Hallo,
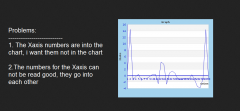
ich habe mit JPGraph eine etwas unklare Ausgabe, ich habe ein Bild dazu gemacht das die Probleme erklaert, wuerde mich freuen wenn jemand helfen.

Das ist der PHP Code dazu:
ich habe mit JPGraph eine etwas unklare Ausgabe, ich habe ein Bild dazu gemacht das die Probleme erklaert, wuerde mich freuen wenn jemand helfen.

Das ist der PHP Code dazu:
PHP:
<?php
include ("jpgraph.php");
include ("jpgraph_line.php");
include ("../configdb.php");


$sql="SELECT * FROM table;

$result = mysqli_query($DatabasePointer,$sql);
$zaehler=0;
$ydata = array();

while($row = mysqli_fetch_array($result))
{
  //Werte fuer Linie
  $ydata[$zaehler]=$row['wert'];
  $zaehler++;
}


// Grafik generieren und Grafiktyp festlegen
$graph = new Graph(410,340,"auto");
$graph->SetScale("textlin");


// Die Zwei Linien generieren
$lineplot=new LinePlot($ydata);


// Die Linien zu der Grafik hinzufügen
$graph->Add($lineplot);


// Grafik Formatieren
$graph->img->SetMargin(40,20,20,40);
$graph->title->Set("Graph");
$graph->xaxis->title->Set("unten");
$graph->yaxis->title->Set("links");


$graph->title->SetFont(FF_FONT1,FS_BOLD);
$graph->yaxis->title->SetFont(FF_FONT1,FS_BOLD);
$graph->xaxis->title->SetFont(FF_FONT1,FS_BOLD);


$lineplot->SetColor("mediumblue");
$lineplot->SetWeight(2);


// Hintergrundfarbe
$graph->SetFrame(true,'lightskyblue2',2);
$graph->SetMarginColor('lightskyblue2');


$graph->yaxis->SetColor("mediumblue");
$graph->yaxis->SetWeight(2);

$graph->xaxis->SetColor("mediumblue");
$graph->xaxis->SetWeight(2);


// Grafik anzeigen
$graph->Stroke();
?>
Zuletzt bearbeitet:
