Mit Debugger interne HotSpot JVM Informationen auslesen in Java 7

Thomas Darimont

Erfahrenes Mitglied
Interner HotSpot Debugger in Java 7

Hallo,

wer schon immer mal in die HotSpot-Innerein der JVM abtauchen wollte hat mit dem Tool HSDB
die Möglichkeit dazu.

Seit Java 7 jdk1.7.0_01 gibt es im Verzeichnis %JAVA7_HOME%\lib\ das Jar: sa-jdi.jar

In diesem Jar befindet sich eine interessante Java Anwendung (HSDB) welche man über folgenden Aufruf starten kann:
Code:
java -cp "C:\Program Files\Java\jdk1.7.0_03\lib\sa-jdi.jar" sun.jvm.hotspot.HSDB

Hat man die Anwendung gestartet kann man sich mit einem HotSpot JVM Java Prozess darauf verbinden, einen
HotSpot Core Dump laden oder sich mit einem DebugServer verbinden.

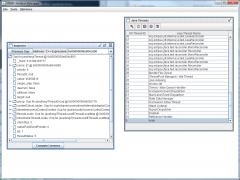
Für's erste berbinden wir uns mal mit einem HotSpot JVM Prozess - Dies geht beispielsweise über:
File -> Attach to HotSpot Process im Eingabefeld gibt man nun die PID (Process ID) eines
entsprechenden Java Prozesses ein. Die PID kann man unter Windows beispielsweise über den Taskmanager herausfinden oder das Java Tool: JPS vewenden.

Code:
C:\Users\Tom>jps
6896 HSDB
1180
7088 Jps
Der Java Prozess 1180 ohne Namen ist meine aktuell Laufende Eclipse Instanz. Ich vermute mal, dass bei der JVM hier kein Name angezeigt wird, da die JVM hier intern vom eclipse launcher (eclipse.exe) erzeugt wurde.

Nichtsdestotrotz können wir uns mit dieser PID verbinden.

Wir sehen eine Auflistung der aktuellen Java Threads mit Ihren OS Thread-Ids und Java Thread Names.
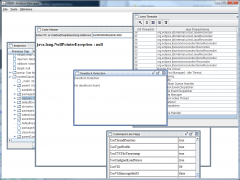
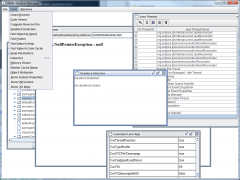
Klicken wir auf einen Thread in der Liste sehen wir die interne Struktur des Threads. Insbesondere die
echten Speicheradressen der hinter den Java Objekten liegenden HotSpot Strukturen.

Darüber hinaus kann man über das menü Tools noch zahlreiche weitere Ansichten erreichen...
Siehe Screenshots :)

Btw. sollte jemand die folgende Fehlermeldung erhalten, dann sucht Java die sawindbg.dll an der falschen Stelle. Diese dll findet man beispielsweise in folgendem Verzeichnis:
C:\Program Files\Java\jdk1.7.0_03\jre\bin hier muss man also gegebenenfalls die DLL kopieren, oder die Umgebungsvariablen entsprechend anpassen.

Code:
C:\Windows\system32>java -cp "C:\Program Files\Java\jdk1.7.0_03\lib\tools.jar;C:\Program Files\Java\jdk1.7.0_03\lib\sa-jdi.jar" sun.jvm.hotspot.HSDB
Exception in thread "Thread-1" java.lang.UnsatisfiedLinkError: Can't load library: C:\Program Files\Java\jre7\bin\sawindbg.dll
        at java.lang.ClassLoader.loadLibrary(Unknown Source)
        at java.lang.Runtime.load0(Unknown Source)
        at java.lang.System.load(Unknown Source)
        at sun.jvm.hotspot.debugger.windbg.WindbgDebuggerLocal.<clinit>(WindbgDebuggerLocal.java:651)
        at sun.jvm.hotspot.HotSpotAgent.setupDebuggerWin32(HotSpotAgent.java:512)
        at sun.jvm.hotspot.HotSpotAgent.setupDebugger(HotSpotAgent.java:335)
        at sun.jvm.hotspot.HotSpotAgent.go(HotSpotAgent.java:312)
        at sun.jvm.hotspot.HotSpotAgent.attach(HotSpotAgent.java:156)
        at sun.jvm.hotspot.HSDB.attach(HSDB.java:1168)
        at sun.jvm.hotspot.HSDB.access$1700(HSDB.java:53)
        at sun.jvm.hotspot.HSDB$25$1.run(HSDB.java:436)
        at sun.jvm.hotspot.utilities.WorkerThread$MainLoop.run(WorkerThread.java:66)
        at java.lang.Thread.run(Unknown Source)


Viel Spaß damit!
Gruß Tom
 

Anhänge

  • HSDB_001.PNG
    HSDB_001.PNG
    101,1 KB · Aufrufe: 56
  • HSDB_002.PNG
    HSDB_002.PNG
    102,2 KB · Aufrufe: 56
  • HSDB_003.PNG
    HSDB_003.PNG
    104,2 KB · Aufrufe: 99
Vielen vielen Dank für deine guten Tipps und dass du dieses Wissen so selbstlos weiter gibst.

Frage zum dem Thema: Mit dem JDK6-Tool jstack (Command-Line) konnte man sich prima anzeigen lassen, welche Threads grad in der VM laufen und welcher auf welche Locks wartet usw. Kann man das mit dem Tool auch machen?

Gibt es die jconsole bei JDK7 noch? Bin bisher nicht dazu gekommen und auch noch nicht bereit, mir das zu installieren... ;-)

Danke und Grüße
 
Hallo,

Vielen vielen Dank für deine guten Tipps und dass du dieses Wissen so selbstlos weiter gibst.

Danke! Keine Ursache - das gleiche kann man von Dir sagen :) Eine Community wie unsere lebt halt vom gemeinsamen Wissen :) Also nur weiter so :D

Frage zum dem Thema: Mit dem JDK6-Tool jstack (Command-Line) konnte man sich prima anzeigen lassen, welche Threads grad in der VM laufen und welcher auf welche Locks wartet usw. Kann man das mit dem Tool auch machen?
Ich hab zumindest mal einen Deadlock-Detector in dem Tool (HotspotDebugger) gesehen.. aber für solche Sachen würde ich Dir JVisualVM empfehlen (siehe unten) oder eben auch jstack. Für die weitere Analyse von Thread Dumps bietet sich auch das Tool TDA (Thread Dump Analyzer -> http://java.net/projects/tda) an.

Gibt es die jconsole bei JDK7 noch? Bin bisher nicht dazu gekommen und auch noch nicht bereit, mir das zu installieren...
Ja JConsole gibt es noch, jedoch verliert das Tool immer mehr an Bedeutung, da es jetzt schon seit längerer Zeit (Java 6) im JDK das viel mächtigere Tool JVisualVM (C:\Program Files\Java\jdk1.7.0_03\bin\jvisualvm.exe) gibt :)


Gruß Tom
 
Danke!
Bei mir läuft das allerdings nicht so gut. Gestartet habe ich (unter Linux) mit
Code:
java -cp "/usr/lib/jvm/java-7-openjdk-amd64/lib/sa-jdi.jar" sun.jvm.hotspot.HSDB
und HSDB zeigt nur an:
Code:
Unable to connect to process ID 9156:

sun.jvm.hotspot.debugger.DebuggerException: Can't attach to the process

EDIT:
Ok, Da man unter Linux nicht mehr ohne höhere Rechte auf den Speicher anderer Prozesse zugreifen kann, braucht man höhere Rechte ;)
 
Zuletzt bearbeitet:
Ja. aber dabei werden leider mit höheren Rechten unnötig Dateien im eigenen Benutzerkonto erstellt. Das Tool wurde also nicht an die neuen Gegebenheiten angepasst. Es funktioniert, aber suboptimal. Sollte man wohl nen BugReport erstellen, denn eigentlich würde es reichen, wenn das Auslesen des Speichers mit höheren Rechten abläuft, der Rest (besonders UI) sollte auf keinen Fall mit höheren Rechten laufen.
 
Hallo,

ein weiteres Tool in dem sa-jdi.jar SysPropDumper:
Code:
C:\Users\tom>"%JAVA_HOME%\bin\java" -cp "%JAVA_HOME%\lib\sa-jdi.jar" sun.jvm.hotspot.tools.SysPropsDumper -h
Usage: java sun.jvm.hotspot.tools.SysPropsDumper [option] <pid>
                (to connect to a live java process)
   or java sun.jvm.hotspot.tools.SysPropsDumper [option] <executable> <core>
                (to connect to a core file)
   or java sun.jvm.hotspot.tools.SysPropsDumper [option] [server_id@]<remote server IP or hostname>
                (to connect to a remote debug server)

where option must be one of:
    -h | -help  to print this help message


Code:
C:\Users\tom>"%JAVA_HOME%\bin\java" -cp "%JAVA_HOME%\lib\sa-jdi.jar" 
sun.jvm.hotspot.tools.SysPropsDumper  PID
(PID mit Taskmanager oder jps ermitteln)

Ausgabe:
Code:
Attaching to process ID 2996, please wait...
Debugger attached successfully.
Server compiler detected.
JVM version is 23.0-b21
java.vendor = Oracle Corporation
...

Gruß Tom
 
Hallo,

weiteres Tool StackTrace:
Code:
C:\Users\tom>"%JAVA_HOME%\bin\java" -cp "%JAVA_HOME%\lib\sa-jdi.jar" sun.jvm.hotspot.tools.StackTrace -h
Usage: java sun.jvm.hotspot.tools.StackTrace [option] <pid>
                (to connect to a live java process)
   or java sun.jvm.hotspot.tools.StackTrace [option] <executable> <core>
                (to connect to a core file)
   or java sun.jvm.hotspot.tools.StackTrace [option] [server_id@]<remote server IP or hostname>
                (to connect to a remote debug server)

where option must be one of:
    -h | -help  to print this help message

C:\Users\tom>"%JAVA_HOME%\bin\java" -cp "%JAVA_HOME%\lib\sa-jdi.jar" sun.jvm.hotspot.tools.StackTrace 2996
Attaching to process ID 2996, please wait...
Debugger attached successfully.
Server compiler detected.
JVM version is 23.0-b21
Deadlock Detection:

No deadlocks found.

none
null_check
null_assert
range_check
class_check
array_check
intrinsic
bimorphic
unloaded
uninitialized
unreached
unhandled
constraint
div0_check
age
...

Gruß Tom
 
Hallo,

weiteres Tool PermStat:
Code:
C:\Users\tom>"%JAVA_HOME%\bin\java" -cp "%JAVA_HOME%\lib\sa-jdi.jar" sun.jvm.hotspot.tools.PermStat
Usage: java sun.jvm.hotspot.tools.PermStat [option] <pid>
                (to connect to a live java process)
   or java sun.jvm.hotspot.tools.PermStat [option] <executable> <core>
                (to connect to a core file)
   or java sun.jvm.hotspot.tools.PermStat [option] [server_id@]<remote server IP or hostname>
                (to connect to a remote debug server)

where option must be one of:
    -h | -help  to print this help message

C:\Users\tom>"%JAVA_HOME%\bin\java" -cp "%JAVA_HOME%\lib\sa-jdi.jar" sun.jvm.hotspot.tools.PermStat 2996
Attaching to process ID 2996, please wait...
Debugger attached successfully.
Server compiler detected.
JVM version is 23.0-b21
finding class loader instances ..none
null_check
null_assert
range_check
class_check
array_check
intrinsic
bimorphic
unloaded
uninitialized
unreached
unhandled
constraint
div0_check
age
predicate
loop_limit_check
Finding object size using Printezis bits and skipping over...
done.
computing per loader stat ..done.
please wait.. computing liveness..........................done.
class_loader    classes bytes   parent_loader   alive?  type

<bootstrap>     3436    22227264          null          live    <internal>
0x00000000f0311b48      0       0       0x00000000f04a8698      live    org/netbeans/StandardModule$OneModuleClassLoader@0x00000000ebb3e0d0
0x00000000f030f9b8      46      581456  0x00000000f04a8698      live    org/netbeans/StandardModule$OneModuleClassLoader@0x00000000ebb3e0d0
0x00000000ff4316c8      1       3104      null          dead    sun/reflect/DelegatingClassLoader@0x00000000eae521f0
0x00000000f0e14810      5       13104   0x00000000f04a8698      live    org/netbeans/StandardModule$OneModuleClassLoader@0x00000000ebb3e0d0
0x00000000ff466cc0      1       3104      null          dead    sun/reflect/DelegatingClassLoader@0x00000000eae521f0
0x00000000f0365010      8       154560  0x00000000f04a8698      live    org/netbeans/StandardModule$OneModuleClassLoader@0x00000000ebb3e0d0
0x00000000f022dfa8      104     1281880 0x00000000f04a8698      live    org/netbeans/StandardModule$OneModuleClassLoader@0x00000000ebb3e0d0
0x00000000ff431288      1       3088      null          dead    sun/reflect/DelegatingClassLoader@0x00000000eae521f0
0x00000000f02ed810      10      110632  0x00000000f04a8698      live    org/netbeans/StandardModule$OneModuleClassLoader@0x00000000ebb3e0d0
0x00000000f03568d8      15      122296  0x00000000f04a8698      live    org/netbeans/StandardModule$OneModuleClassLoader@0x00000000ebb3e0d0
0x00000000ff447010      1       3088      null          dead    sun/reflect/DelegatingClassLoader@0x00000000eae521f0
0x00000000f0888d30      1       3088      null          dead    sun/reflect/DelegatingClassLoader@0x00000000eae521f0
0x00000000f0316aa0      0       0       0x00000000f04a8698      live    org/netbeans/StandardModule$OneModuleClassLoader@0x00000000ebb3e0d0
0x00000000f03490a8      59      369376  0x00000000f04a8698      live    org/netbeans/StandardModule$OneModuleClassLoader@0x00000000ebb3e0d0
0x00000000f042b0f0      1       1944      null          dead    sun/reflect/DelegatingClassLoader@0x00000000eae521f0
0x00000000ff4682e0      1       3088      null          dead    sun/reflect/DelegatingClassLoader@0x00000000eae521f0
0x00000000ff431388      1       3088      null          dead    sun/reflect/DelegatingClassLoader@0x00000000eae521f0
0x00000000f06b8b80      12      55368   0x00000000f04a8698      live    org/netbeans/StandardModule$OneModuleClassLoader@0x00000000ebb3e0d0
0x00000000f0888c30      1       1928      null          dead    sun/reflect/DelegatingClassLoader@0x00000000eae521f0
0x00000000f0348388      19      170456  0x00000000f04a8698      live    org/netbeans/StandardModule$OneModuleClassLoader@0x00000000ebb3e0d0
0x00000000f0243858      0       0       0x00000000f04a8698      live    org/netbeans/StandardModule$OneModuleClassLoader@0x00000000ebb3e0d0
0x00000000ff4314c8      1       3088    0x00000000f04a8698      dead    sun/reflect/DelegatingClassLoader@0x00000000eae521f0
0x00000000f0888b70      1       1928      null          dead    sun/reflect/DelegatingClassLoader@0x00000000eae521f0
0x00000000f0301490      43      547744  0x00000000f04a8698      live    org/netbeans/StandardModule$OneModuleClassLoader@0x00000000ebb3e0d0
0x00000000f033dad0      311     2791144 0x00000000f04a8698      live    org/netbeans/StandardModule$OneModuleClassLoader@0x00000000ebb3e0d0
0x00000000f03117b0      0       0       0x00000000f04a8698      live    org/netbeans/StandardModule$OneModuleClassLoader@0x00000000ebb3e0d0
0x00000000ff4315c8      1       3096      null          dead    sun/reflect/DelegatingClassLoader@0x00000000eae521f0
0x00000000f0d31660      37      490272  0x00000000f04a8698      live    org/netbeans/StandardModule$OneModuleClassLoader@0x00000000ebb3e0d0
0x00000000f03159d0      167     1734712 0x00000000f04a8698      live    org/netbeans/StandardModule$OneModuleClassLoader@0x00000000ebb3e0d0
0x00000000f0244fd8      61      374488  0x00000000f04a8698      live    org/netbeans/StandardModule$OneModuleClassLoader@0x00000000ebb3e0d0
0x00000000f0a72140      358     3124184 0x00000000f04a8698      live    org/netbeans/StandardModule$OneModuleClassLoader@0x00000000ebb3e0d0
0x00000000f0237318      0       0       0x00000000f04a8698      live    org/netbeans/StandardModule$OneModuleClassLoader@0x00000000ebb3e0d0
0x00000000f0888e30      1       1928      null          dead    sun/reflect/DelegatingClassLoader@0x00000000eae521f0
0x00000000f0323830      0       0       0x00000000f04a8698      live    org/netbeans/StandardModule$OneModuleClassLoader@0x00000000ebb3e0d0
0x00000000f02fafa0      0       0       0x00000000f04a8698      live    org/netbeans/StandardModule$OneModuleClassLoader@0x00000000ebb3e0d0
0x00000000f0d2c290      9       72808   0x00000000f04a8698      live    org/netbeans/StandardModule$OneModuleClassLoader@0x00000000ebb3e0d0
0x00000000ff431188      1       3096      null          dead    sun/reflect/DelegatingClassLoader@0x00000000eae521f0
0x00000000f03697d8      36      355472  0x00000000f04a8698      live    org/netbeans/StandardModule$OneModuleClassLoader@0x00000000ebb3e0d0
0x00000000ff469e48      1       3096      null          dead    sun/reflect/DelegatingClassLoader@0x00000000eae521f0
...

Gruß Tom
 
Hallo,

Tool PStack: Listet den nativen StackTrace auf
Code:
C:\Users\tom>"%JAVA_HOME%\bin\java" -cp "%JAVA_HOME%\lib\sa-jdi.jar" sun.jvm.hotspot.tools.PStack
Usage: java sun.jvm.hotspot.tools.PStack [option] <pid>
                (to connect to a live java process)
   or java sun.jvm.hotspot.tools.PStack [option] <executable> <core>
                (to connect to a core file)
   or java sun.jvm.hotspot.tools.PStack [option] [server_id@]<remote server IP or hostname>
                (to connect to a remote debug server)

where option must be one of:
    -h | -help  to print this help message

C:\Users\tom>"%JAVA_HOME%\bin\java" -cp "%JAVA_HOME%\lib\sa-jdi.jar" sun.jvm.hotspot.tools.PStack 2996
Attaching to process ID 2996, please wait...
Debugger attached successfully.
Server compiler detected.
JVM version is 23.0-b21
none
null_check
null_assert
range_check
class_check
array_check
intrinsic
bimorphic
unloaded
uninitialized
unreached
unhandled
constraint
div0_check
age
predicate
loop_limit_check
Finding object size using Printezis bits and skipping over...
Deadlock Detection:

No deadlocks found.

----------------- 0 -----------------
0x00000000772d135a      ntdll!NtWaitForSingleObject + 0xa
0xec8b485741564155              ****************
sun.jvm.hotspot.debugger.DebuggerException: Windbg Error: ReadVirtual failed!
        at sun.jvm.hotspot.debugger.windbg.WindbgDebuggerLocal.readBytesFromProcess0(Native Method)
        at sun.jvm.hotspot.debugger.windbg.WindbgDebuggerLocal.readBytesFromProcess(WindbgDebuggerLocal.java:485)
        at sun.jvm.hotspot.debugger.DebuggerBase$Fetcher.fetchPage(DebuggerBase.java:76)
        at sun.jvm.hotspot.debugger.PageCache.getPage(PageCache.java:178)
        at sun.jvm.hotspot.debugger.PageCache.getLong(PageCache.java:100)
        at sun.jvm.hotspot.debugger.DebuggerBase.readCInteger(DebuggerBase.java:356)
        at sun.jvm.hotspot.debugger.DebuggerBase.readAddressValue(DebuggerBase.java:454)
        at sun.jvm.hotspot.debugger.windbg.WindbgDebuggerLocal.readAddress(WindbgDebuggerLocal.java:316)
        at sun.jvm.hotspot.debugger.windbg.WindbgAddress.getAddressAt(WindbgAddress.java:72)
        at sun.jvm.hotspot.debugger.cdbg.basic.amd64.AMD64CFrame.sender(AMD64CFrame.java:51)
        at sun.jvm.hotspot.tools.PStack.run(PStack.java:161)
        at sun.jvm.hotspot.tools.PStack.run(PStack.java:53)
        at sun.jvm.hotspot.tools.PStack.run(PStack.java:48)
        at sun.jvm.hotspot.tools.Tool.start(Tool.java:221)
        at sun.jvm.hotspot.tools.PStack.main(PStack.java:189)
----------------- 1 -----------------
Locked ownable synchronizers:
    - None
----------------- 2 -----------------
----------------- 3 -----------------
----------------- 4 -----------------
----------------- 5 -----------------
----------------- 6 -----------------
----------------- 7 -----------------
----------------- 8 -----------------
----------------- 9 -----------------
----------------- 10 -----------------
0x00000000772d135a      ntdll!NtWaitForSingleObject + 0xa
----------------- 11 -----------------
0x00000000772d135a      ntdll!NtWaitForSingleObject + 0xa
Locked ownable synchronizers:
    - None
----------------- 12 -----------------
0x00000000772d135a      ntdll!NtWaitForSingleObject + 0xa
Locked ownable synchronizers:
    - None
----------------- 13 -----------------
0x00000000772d135a      ntdll!NtWaitForSingleObject + 0xa
sun.jvm.hotspot.debugger.UnalignedAddressException: 1
        at sun.jvm.hotspot.debugger.windbg.WindbgDebuggerLocal$1.checkAlignment(WindbgDebuggerLocal.java:104)
        at sun.jvm.hotspot.debugger.DebuggerBase.readCInteger(DebuggerBase.java:349)
        at sun.jvm.hotspot.debugger.DebuggerBase.readAddressValue(DebuggerBase.java:454)
        at sun.jvm.hotspot.debugger.windbg.WindbgDebuggerLocal.readAddress(WindbgDebuggerLocal.java:316)
        at sun.jvm.hotspot.debugger.windbg.WindbgAddress.getAddressAt(WindbgAddress.java:72)
        at sun.jvm.hotspot.debugger.cdbg.basic.amd64.AMD64CFrame.sender(AMD64CFrame.java:51)
        at sun.jvm.hotspot.tools.PStack.run(PStack.java:161)
        at sun.jvm.hotspot.tools.PStack.run(PStack.java:53)
        at sun.jvm.hotspot.tools.PStack.run(PStack.java:48)
        at sun.jvm.hotspot.tools.Tool.start(Tool.java:221)
        at sun.jvm.hotspot.tools.PStack.main(PStack.java:189)
Locked ownable synchronizers:
    - None
----------------- 14 -----------------
0x00000000772d135a      ntdll!NtWaitForSingleObject + 0xa
0x0000000000007365              ****************
sun.jvm.hotspot.debugger.DebuggerException: Windbg Error: ReadVirtual failed!
        at sun.jvm.hotspot.debugger.windbg.WindbgDebuggerLocal.readBytesFromProcess0(Native Method)
        at sun.jvm.hotspot.debugger.windbg.WindbgDebuggerLocal.readBytesFromProcess(WindbgDebuggerLocal.java:485)
        at sun.jvm.hotspot.debugger.DebuggerBase$Fetcher.fetchPage(DebuggerBase.java:76)
        at sun.jvm.hotspot.debugger.PageCache.getPage(PageCache.java:178)
        at sun.jvm.hotspot.debugger.PageCache.getLong(PageCache.java:100)
        at sun.jvm.hotspot.debugger.DebuggerBase.readCInteger(DebuggerBase.java:356)
        at sun.jvm.hotspot.debugger.DebuggerBase.readAddressValue(DebuggerBase.java:454)
        at sun.jvm.hotspot.debugger.windbg.WindbgDebuggerLocal.readAddress(WindbgDebuggerLocal.java:316)
        at sun.jvm.hotspot.debugger.windbg.WindbgAddress.getAddressAt(WindbgAddress.java:72)
        at sun.jvm.hotspot.debugger.cdbg.basic.amd64.AMD64CFrame.sender(AMD64CFrame.java:51)
        at sun.jvm.hotspot.tools.PStack.run(PStack.java:161)
        at sun.jvm.hotspot.tools.PStack.run(PStack.java:53)
        at sun.jvm.hotspot.tools.PStack.run(PStack.java:48)
        at sun.jvm.hotspot.tools.Tool.start(Tool.java:221)
        at sun.jvm.hotspot.tools.PStack.main(PStack.java:189)
Locked ownable synchronizers:
    - None
----------------- 15 -----------------
Locked ownable synchronizers:
    - None
----------------- 16 -----------------
Locked ownable synchronizers:
    - None
----------------- 17 -----------------
Locked ownable synchronizers:
    - None
----------------- 18 -----------------
0x00000000772d135a      ntdll!NtWaitForSingleObject + 0xa
----------------- 19 -----------------
0x00000000772d135a      ntdll!NtWaitForSingleObject + 0xa
Locked ownable synchronizers:
    - None
----------------- 20 -----------------
0x00000000772d135a      ntdll!NtWaitForSingleObject + 0xa
Locked ownable synchronizers:
    - None
----------------- 21 -----------------
----------------- 22 -----------------
Locked ownable synchronizers:
    - None
----------------- 23 -----------------
0x00000000772d135a      ntdll!NtWaitForSingleObject + 0xa
0x616c2f6176616a10              ****************
sun.jvm.hotspot.debugger.DebuggerException: Windbg Error: ReadVirtual failed!
        at sun.jvm.hotspot.debugger.windbg.WindbgDebuggerLocal.readBytesFromProcess0(Native Method)
        at sun.jvm.hotspot.debugger.windbg.WindbgDebuggerLocal.readBytesFromProcess(WindbgDebuggerLocal.java:485)
        at sun.jvm.hotspot.debugger.DebuggerBase$Fetcher.fetchPage(DebuggerBase.java:76)
        at sun.jvm.hotspot.debugger.PageCache.getPage(PageCache.java:178)
        at sun.jvm.hotspot.debugger.PageCache.getLong(PageCache.java:100)
        at sun.jvm.hotspot.debugger.DebuggerBase.readCInteger(DebuggerBase.java:356)
        at sun.jvm.hotspot.debugger.DebuggerBase.readAddressValue(DebuggerBase.java:454)
        at sun.jvm.hotspot.debugger.windbg.WindbgDebuggerLocal.readAddress(WindbgDebuggerLocal.java:316)
        at sun.jvm.hotspot.debugger.windbg.WindbgAddress.getAddressAt(WindbgAddress.java:72)
        at sun.jvm.hotspot.debugger.cdbg.basic.amd64.AMD64CFrame.sender(AMD64CFrame.java:51)
        at sun.jvm.hotspot.tools.PStack.run(PStack.java:161)
        at sun.jvm.hotspot.tools.PStack.run(PStack.java:53)
        at sun.jvm.hotspot.tools.PStack.run(PStack.java:48)
        at sun.jvm.hotspot.tools.Tool.start(Tool.java:221)
        at sun.jvm.hotspot.tools.PStack.main(PStack.java:189)
Locked ownable synchronizers:
    - None
----------------- 24 -----------------
0x00000000772d135a      ntdll!NtWaitForSingleObject + 0xa
Locked ownable synchronizers:
    - None
----------------- 25 -----------------
0x00000000772d135a      ntdll!NtWaitForSingleObject + 0xa
Locked ownable synchronizers:
    - None
----------------- 26 -----------------
Locked ownable synchronizers:
    - None
----------------- 27 -----------------
0x00000000772d135a      ntdll!NtWaitForSingleObject + 0xa
Locked ownable synchronizers:
    - None
----------------- 28 -----------------
0x00000000772d135a      ntdll!NtWaitForSingleObject + 0xa
Locked ownable synchronizers:
    - None
----------------- 29 -----------------
0x00000000772d135a      ntdll!NtWaitForSingleObject + 0xa
Locked ownable synchronizers:
    - None
----------------- 30 -----------------
0x00000000772d135a      ntdll!NtWaitForSingleObject + 0xa
Locked ownable synchronizers:
    - <0x00000000f06b7b38>, (a java/util/concurrent/locks/ReentrantLock$NonfairSync)
----------------- 31 -----------------
0x00000000772d135a      ntdll!NtWaitForSingleObject + 0xa
Locked ownable synchronizers:
    - None
----------------- 32 -----------------
0x00000000772d135a      ntdll!NtWaitForSingleObject + 0xa
Locked ownable synchronizers:
    - None
----------------- 33 -----------------
0x00000000772d135a      ntdll!NtWaitForSingleObject + 0xa
Locked ownable synchronizers:
    - None
----------------- 34 -----------------
----------------- 35 -----------------
0x00000000772d135a      ntdll!NtWaitForSingleObject + 0xa
Locked ownable synchronizers:
    - None
----------------- 36 -----------------
0x00000000772d135a      ntdll!NtWaitForSingleObject + 0xa
0x0000000001e21290              ****************
0x0000000001e20738              ****************
0x000000006402d9b0      jvm!JVM_EnableCompiler + 0x16d740
0x0d751c42391c418b              ****************
sun.jvm.hotspot.debugger.UnalignedAddressException: 157518423918418b
        at sun.jvm.hotspot.debugger.windbg.WindbgDebuggerLocal$1.checkAlignment(WindbgDebuggerLocal.java:104)
        at sun.jvm.hotspot.debugger.DebuggerBase.readCInteger(DebuggerBase.java:349)
        at sun.jvm.hotspot.debugger.DebuggerBase.readAddressValue(DebuggerBase.java:454)
        at sun.jvm.hotspot.debugger.windbg.WindbgDebuggerLocal.readAddress(WindbgDebuggerLocal.java:316)
        at sun.jvm.hotspot.debugger.windbg.WindbgAddress.getAddressAt(WindbgAddress.java:72)
        at sun.jvm.hotspot.debugger.cdbg.basic.amd64.AMD64CFrame.sender(AMD64CFrame.java:51)
        at sun.jvm.hotspot.tools.PStack.run(PStack.java:161)
        at sun.jvm.hotspot.tools.PStack.run(PStack.java:53)
        at sun.jvm.hotspot.tools.PStack.run(PStack.java:48)
        at sun.jvm.hotspot.tools.Tool.start(Tool.java:221)
        at sun.jvm.hotspot.tools.PStack.main(PStack.java:189)
Locked ownable synchronizers:
    - None
...

Gruß Tom
 

Neue Beiträge

Zurück