Hallo,
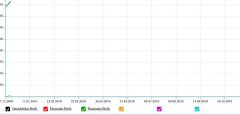
habe ein Diagramm hochgeladen und nachträglich 3 Linien hinzugefügt.
Bei den 3 hinzugefügten wird aber der Titel in der Legende nicht angezeigt und
auch die falschen Websicheren Farben.
Im Diagramm selbst wird der wert richtig angezeigt aber trotzdem falsche Farben.
Anbei ein Bild zur Erklärung meines Problems.
Hier noch der Code für die Einstelllung es handelt sich um Grafik (gid) 4-6:
<?xml version="1.0" encoding="UTF-8"?>
<settings>
<font>Garamond</font>
<hide_bullets_count>18</hide_bullets_count>
<preloader_on_reload>1</preloader_on_reload>
<add_time_stamp>1</add_time_stamp>
<background>
<alpha>90</alpha>
<border_alpha>10</border_alpha>
</background>
<plot_area>
<margins>
<left>50</left>
<right>40</right>
<bottom>65</bottom>
</margins>
</plot_area>
<grid>
<x>
<alpha>10</alpha>
<dash_length>4</dash_length>
<approx_count>9</approx_count>
</x>
<y_left>
<alpha>10</alpha>
</y_left>
</grid>
<axes>
<x>
<width>1</width>
<color>0099CC</color>
</x>
<y_left>
<width>1</width>
<color>0099CC</color>
</y_left>
</axes>
<indicator>
<color>3333FF</color>
<x_balloon_text_color>FFFFFF</x_balloon_text_color>
<line_alpha>50</line_alpha>
<selection_color>0099CC</selection_color>
<selection_alpha>20</selection_alpha>
</indicator>
<zoom_out_button>
<text_color_hover>FF0000</text_color_hover>
</zoom_out_button>
<help>
<button>
<color>3333FF</color>
<text_color>FFFFFF</text_color>
<text_color_hover>FF0000</text_color_hover>
</button>
<balloon>
<text><![CDATA[Click on the graph to turn on/off value baloon <br/><br/>Click on legend key to show/hide graph<br/><br/>Mark the area you wish to enlarge]]></text>
<color>3333FF</color>
<text_color>FFFFFF</text_color>
</balloon>
</help>
<graphs>
<graph gid="1">
<title>Tatsächlicher Profit</title>
<color>000000</color>
<color_hover>000000</color_hover>
<line_width>2</line_width>
<bullet>round</bullet>
</graph>
<graph gid="2">
<title>Minimaler Profit</title>
<color>FF0000</color>
<color_hover>FF0000</color_hover>
<line_width>2</line_width>
<bullet>round</bullet>
</graph>
<graph gid="3">
<title>Maximaler Profit</title>
<color>009900</color>
<color_hover>009900</color_hover>
<line_width>2</line_width>
<bullet>round</bullet>
</graph>
<graphs>
<graph gid="4">
<title>Tatsächliche %</title>
<color>3366CC</color>
<color_hover>3366CC</color_hover>
<line_width>2</line_width>
<bullet>round</bullet>
</graph>
<graphs>
<graph gid="5">
<title>Minimum %</title>
<color>FF0000</color>
<color_hover>FF0000</color_hover>
<line_width>2</line_width>
<bullet>round</bullet>
</graph>
<graphs>
<graph gid="6">
<title>Maximum %</title>
<color>009900</color>
<color_hover>009900</color_hover>
<line_width>2</line_width>
<bullet>round</bullet>
</graph>
</graphs>
<labels>
<label lid="0">
<text><![CDATA[<b>Cashday 2009 - 2010</b>]]></text>
<y>25</y>
<text_size>18</text_size>
<align>center</align>
</label>
</labels>
</settings>